Thursday, October 29, 2015

Hey everyone!

I am Donovan King, a biologist, and I joined the LoVoTECS team as a field technician a few months ago after finishing my MS with Plymouth State University.

We have some exciting new work emerging for our LoVoTECS network.

We are currently in the process of moving our research upstream. We will continue to analyze the valuable data we obtained from all of your sites, but we are shifting our focus to the White Mountain tributaries. We will be further exploring the intrusion of road salt into streams at road crossings beginning this 2015/16 winter.

The Cary Institute notes that New Hampshire was the pioneer of using salt to deice our roadways, beginning our first experimental treatments in 1938. The ingenuity has made our highways safer and undoubtedly saved countless lives, but not without environmental consequences. Excess salt poses a risk to our stream ecosystems and contaminates the ground water feeding municipal drinking wells and reservoirs. Today, in the White Mountain region alone, we apply some 25 thousand tons of salt each year to maintain driving conditions on state roads and, likely in response to changing weather patterns, our annual road salt use has been increasing. Local roads and private landholders contribute even more, though the exact amounts are hard to ascertain.

Understanding how the direct input of salt from the road and the legacy salt of previous seasons leeching from soils and ground water interact is crucial to informed policy making. Our new research will attempt to isolate background ions – resulting from natural weathering - from the contribution of ions from deicing salts and pair this information with stream flow rates. To do this, we are installing standardized road salt monitoring sites with paired upstream and downstream sensors placed at prescribed distances from the road (see figure below). We hope to have all sites installed and collecting data prior to the 2015/2016 ice over.


 In the Squam Lakes region, we are pairing our research with that of two new graduate students:

Rebecca Hanson is with the Squam Lakes Association. They have been monitoring water quality in the Squam Lake since 1979. She hopes to expand monitoring to our tributaries and examine modern threats to water quality, such as impacts from road salt application. This will better help the SLA to achieve their mission to protect the Squam Lakes and Watershed. Information gathered from this study will help to inform the updated Squam Watershed Plan, and enable them to not just monitor the lakes, but to take action in restoration and protection.

Anju Shrestha is researching a proof of concept to monitor phosphorous input into the lake. She will attempt to pair specific conductivity to phosphorous loading in the streams. If successful, this could improve the usefulness of our data collection methods.

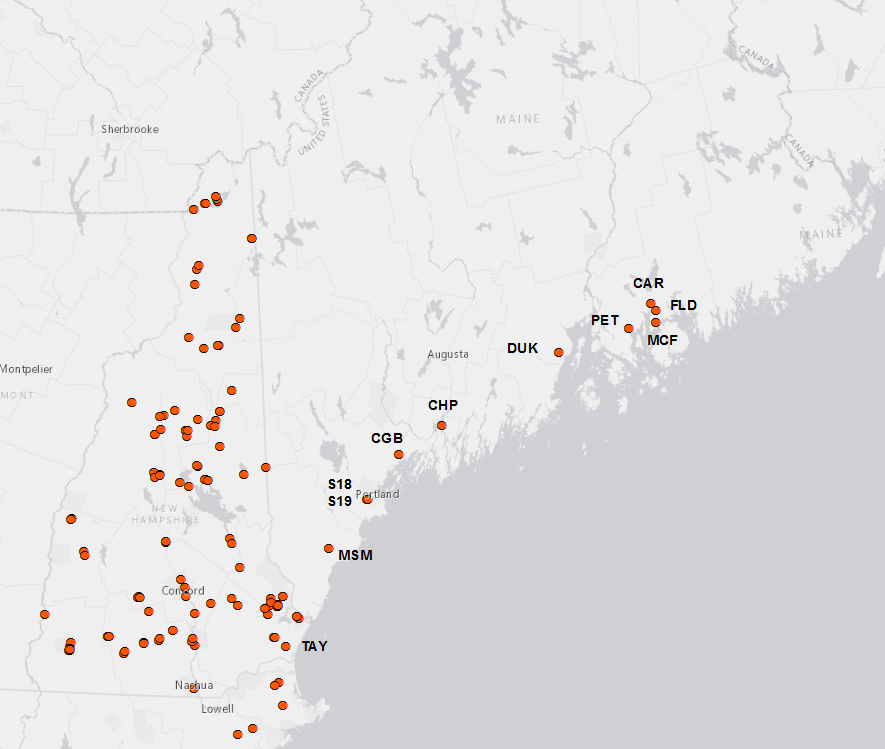
We will be installing at least two of our standardized road salt monitoring sites on Squam Lake tributaries (see map below). Salt use along the northern watershed of Squam Lake, Rt. 113, has been increasing since 1997. Then, an average of 6.98 tons of salt per lane mile was applied. In 2015, the average salt per lane mile has more than doubled to 15.96 tons.

Map of Squam Lakes Sites

In contrast, the Tenney Mountain Hwy (Rt. 25) has seen a sporadic history of annual salt application from as little as 15 to as much as 30 tons per lane mile, with no noticeable change over the last 18 years. Here, we have installed a standardized monitoring site in Clay Brook.

The west end of the Kancamagus (Rt. 112) will also receive several standardized monitoring sites, though the exact locations are still being explored. We hope in the coming weeks to have chosen some informative locations so we can begin to collect data. The Kancamagus is exciting because road salt use is on the decline for NH’s famous roadway; from >20 tons per lane mile in the late 90s and peaking at 43 in 2003, application rates have been down to the teens for the last three years.

Friday, May 8, 2015

Snapshot Results from 2013 & 2014

Happy Spring Everyone!
Please follow this link to view the LoVoTECS Snapshot results from Summer 2013 and 2014. Feel free to ping us with any questions!

Tuesday, December 2, 2014

LoVoTECS expands into coastal Maine to investigate beach & shellfish flat closures


Last year, Plymouth State University was the partial recipient of a grant from the National Science Foundation to integrate research across state lines.  As a result, LoVoTECS expanded its network into coastal Maine in order to investigate water quality related to closure of beaches and shellfish flats (http://www.newenglandsustainabilityconsortium.org/safe-beaches-shellfish).  We are excited to welcome our new partners, who include: the Hancock & Cumberland County Soil and Water Conservation Districts, City of Ellsworth, Kennebec Esutary Land Trust, UMaine Cooperative Extension/Tanglewood 4-H Camp, Coastal Studies for Girls and the Town of Hampton!

Below is a list of the new sites installed this field season: 
1.   Mousam River, Kennebunk, ME  (MSM)
2.  Card Brook, Ellsworth, ME (CAR)
3.  McFarland Brook, Trenton, ME (MCF)
4.  Flood Steam, Surry, ME (FLD)
5.  Peters Brook, E. Blue Hill, ME (PET)
6. Long Creek, Portland, ME (2 sites: S18, S19)
7. Concord Gully, Freeport, ME (CGB)
8.  Merrymeeting Bay/Chopps Point, Woolwich , ME (CHP)
9.  Ducktrap River, Lincolnville, ME (DUK)
10. Taylor River, Hampton, NH (TAY)


Our data will help provide information for other interests besides beach and shellfish closures- Check out the restoration project at Long Creek site: http://www.restorelongcreek.org/

New Graduate Student

Hi everyone!
Baker River, Plymouth NH
Photograph by Lisa Scott

My name is Dan Demers and I’m an Environmental Science and Policy graduate assistant at Plymouth State University working with data from the LoVoTECS Network.

Prior to joining the program, I graduated from Westfield State University in 2011 with a Bachelor’s of Science in Environmental Science and worked in a semi-volatile organic compound laboratory in Western Massachusetts.

Currently, I am looking at the characteristics of specific electrical conductance (SpEC) at certain LoVoTECS sensor sites. SpEC is electrical conductance (which is measured by the black, HOBO U24 sensors) after it has been corrected for the temperature of the water. It is a measure of how well water conducts electricity, increasing with the addition of dissolved solids. Pure, deionized water does not conduct electricity at all, so this measurement can help us learn about the presence and movement of ions within our streams.

Here in New Hampshire, road salt is one of the key factors that increases the SpEC of water, but it isn’t the only material that does this, as you can see from the 2013 and 2014 snapshot results (link coming soon). If the SpEC conductance of water becomes too high, it can affect organisms living in the stream.

Usually when a storm occurs, the SpEC in a stream dilutes with the addition of the new rain-water. However, during the beginning of some storm events, at some sensor sites, the SpEC will briefly increase before diluting. This increase, caused by a flushing of solutes into the stream (known as first flush), can be quite large in some instances, even reaching levels which can have an acute effect on lotic organisms.

I’m specifically looking at sensor sites in the network that exhibit this first flush behavior in order to analyze how the events are affected by seasonality, storm intensity, and the environmental conditions since a previous storm. Essentially this means that I’m studying how time affects the ways in which solute flushing events occur and behave.

Going forward, I hope to be able to accurately predict the presence, duration, and magnitude of solute flushing at certain sites. This knowledge will increase understanding of how water and solutes are transported within our local environment and will be able to indicate which environmental conditions might lead to SpEC-related problems for some lotic organisms’ well-being.

Monday, October 13, 2014

Tracing Urban Stormwater

Our partners at Keene High School, Keene State College, and technician Errin have been monitoring Beaver Brook above and below the city of Keene (sites BBU and BBD, respectively). They also have sensors in an urban storm drain (site BWS) that contributes to Beaver Creek between BBU and BBD. We have enjoyed viewing the data, so thought that we would share.


Below is a time series from October 2013 showing water stage and specific electrical conductance at the three sites, highlighting three storms. The first is on Oct 4, which barely impacts the upstream site, has a clear signal in the storm drain, and that signal is also strong downstream of town. The rapid increase in stage and decrease in specific electrical conductance (SpEC) are typical storm responses within the LoVoTECS network. Groundwater is generally saltier than rain - thus the higher SpEC at low flows - and so direct runoff of rain dilutes a stream. But, the upstream site does not show a substantial stage or SpEC change after the Oct 4 event, which was about 0.5 inches of rain according to area CoCoRaHS observers. The two next waves of rain on Oct 6 and 8, were generally smaller than the Oct 4 amount, but the storm drain reacts strongly and so does the BBD downstream site. The upstream site shows some response to the Oct 6 and 8 rain, but much less than the other sites.


This clear impact of urban drainage on direct runoff to streams is novel. Because urban areas are so small relative to other land covers in a watershed, it is difficult to detect the hydrologic impact of urbanization in watersheds (see Hollis' critical view and O'Driscoll's recent review). Our partners and their sensors are seeing the impact.

Thursday, September 11, 2014

102 sites were sampled on 9/3/14!!! Check out your site's data and compare to July!

SITE System Time of Sampling pH  Sp Cond (us/cm) Turbidity (NTU)
ARD Androscoggin 10:30 7.04 31.05 2.78
ARU Androscoggin 9:50 6.96 28.57 1.1
BAT Borthwick Ave 8:45-8:50 7.87 1.347 11.2
BBD Beaver Brook 3:25 6.8 223.9 1.44
BBK Bogle Brook 11:55 6.65 32.65 1.47
BBO Bear Brook 9:10 6.3 56.15 0.766
BBU Beaver Brook 3:05 7.02 98.34 1.61
BBW Beaver Brook 12:15 6.94 176.8 1.78
BDC Burley Demerrit 7:00 7.7 262.3 2.13
BDD Blood Brook        
BDU Blood Brook        
BEC Beards Creek 12:00 7.98 342.8 4.93
BEF Albany Brook 7:30 6.86 19.16 0.266
BLD Back Lake Brook 7:15 7.58 73.07 3.54
BLU Back Lake Brook 7:00 7.18 67.7 4.57
BRD Bellamy River 1:55-2:00 7.46 202.5 10
BRU Bellamy River 8:45-8:50 7.18 187.8 14.1
BSW Beaver Brook 12:45 7.59 1158 0.352
CBT Clay Brook 8:38 7.04 87.46 0.901
CBU Clay Brook 9:03 7.19 43.59 1.66
CCK Cart Creek 10:50 7.07 526.2 10.5
CHB Chesley Brook 11:05 7.12 255.5 2.73
COB College Brook 11:25 7.97 860 3.23
CRD Creamery Brook 8:52 7.15 216.3 5.08
CRU Creamery Brook 9:00 6.93 203.1 0.465
CSP Cedar Swamp 9:40 5.87 267.6 5.44
CTC Connecticut 11:30 7.39 39.29 2.8
CTP Connecticut River 12:15 7.32 33.77 5.55
DBB Dube Brook 10:35 7.08 113.6 8.66
DCF Dowst-Cate 9:45 6.91 49.07 1.4
DGB Douglas Brook 11:55 6.92 23.89 1.04
ELL Ellis River 12:35 6.61 35.91 0.219
EMB Emerson Brook 10:05 6.89 22.21 0.107
EXT Exeter River        
HBF Paradise Brook 7:50 6.32 14.29 2.97
HCA Hosley Brook 9:30 6.49 16.96 0.446
HCB Hosley Brook 11:30 6.66 31.89 0.867
HCD Hosley Brook 11:25 6.86 32.72 1.33
HCE Hosley Brook 10:00 6.68 23.79 0.209
HCF Hosley Brook 11:15 6.89 30.57 6.78
HCG Hosley Brook 10:50 6.81 30.89 1.26
HCH Hosley Brook 10:40 6.8 31.48 0.764
HCI Hosley Brook 10:20 6.31 32.46 0.771
HCJ Hosley Brook 11:00 6.5 29.89 0.799
HCK Hosley Brook 10:30 6.79 32.46 1.08
HOB Hodgson Brook 9:10-9:15 7.72 760 1.98
HYB Halfway Brook 7:29 7.28 118.7 1.5
IDM Ispwich Dam 10:30 7.06 417.8 2.64
IRD Israel River 8:30 6.94 52.72 5.39
IRU Israel River 9:35 6.95 24.65 3.02
JOB Johnson Brook 10:45 7.09 25.73 0.53
LND Pemigewasset River 3:20 6.65 28.65 0.196
MCQ McQuesten Brook 10:45 7.68 634.5 2.39
MEB Middle Brook 8:13 7.22 81.73 4.87
MMR Merrymeeting River 9:15 6.33 74.39 0.796
MOD Moose River 8:35 6.6 57.87 2.09
MOU Moose River 9:15 7 87.79 7.01
MOX Merrimack River   6.95 93.18 1.02
MRC Mad River 7:01 6.86 39.19 1.07
MRL Mad River        
MUC Merrimack River 10:45 7.13 90.02 0.816
MUM Merrimack River   7.08 98.6 1.08
MWW Merrimack River 11:15 7 94.21 0.898
NED Contocook 11:10 - 11:30 7.51 95.21 0.818
NEU Contocook 11:45 7.19 86.68 0.918
NSB Salmon Brook 8:13 7.75 371.3 2.35
NWD Newfields Ditch 9:25-9:30 7.83 770.8 2.81
OBG Otter Brook 11:40 7.23 100 1.54
OGS Oyster River at USGS 10:52 7.11 175.7 9.95
OMP Oyster River at Mill Pond Dam 11:43 7.68 296.1 2.94
OSS Ossipee River   6.85 51.17 0.419
PBB Pine Bend Brook 10:45 6.89 20.43 0.252
PBD Piscataquog 9:07 7.07 77.06 1.66
PBI Main Piscataquog 8:07 7.01 120.8 1.22
PBU South Piscataquog 8:51 7.1 80.72 2.06
PDM Parker Dam 11:10 7.52 413.7 1.74
PEB Pettee Brook 12:16 7.7 751.6 1.74
PGS Paugus Brook 10:50 6.6 22.43 0.182
PIN Pine River   6.95 75.42 1.04
PRF Pemigewasset River 11:41 6.95 76.58 0.889
PRG Piscataquog 6:10 7.27 104.4 1.41
PRP Pemigewasset River 9:34 6.99 93.3 1.09
PRW Pemigewasset River 3:50 6.88 72.14 0.363
PWU North Piscataquog 7:50 7.02 62.01 0.821
RHB Rand Brook 10:09 6.88 52.17 5.22
RHL Red Hill River 7:44 7.22 63.26 0.605
SBK Sawmill Brook 9:10 7.16 1405 2.81
SBM Saddleback 9:30 6.26 31.08 0.127
SCD Dead Dimond River 8:00 7.08 42.36 1.16
SCS Swift Diamond River 8:30 7.26 32.97 1
SHB Schoolhouse Brook 10:55 7.29 34.42 1.01
SLB Slide Brook 9:21 6.91 27.29 0.412
SNB Shannon Brook 8:26 7.4 80.8 2.82
SQB Unnamed Belnap Woods 9:50 7.28 118.2 0.635
SQM Mill Brook 10:13 6.94 49.06 0.427
SQR Squamscott River        
SRM Swift River 1:30 6.41 27.99 0.478
SRU Swift Upper 9:20 6.37 48.87 0.419
SRN Sugar River North 2:11 7.25 120.8 1.73
SRS Sugar River South 2:36 7.14 98.18 3.55
SWP Storm Drain (Highland St) 9:21 7.81 1428 3.48
TPB Trout Pond Brook 8:30 6.57 19.34 0.736
USW Pemigewasset River 4:15 6.37 62.2 0.388
WAM Wild Ammonoosuc 2:55 7.15 59.01 0.435
WBG Whittle Brook 6:15 7.26 108.5 0.96
WHB Wednesday Hill Brook 7:30 7.93 369.1 4.67
WIN Winnepesauke River 11:20 7.27 107.4 4.84

Wednesday, August 6, 2014

Hi Everyone! Thank you so much for making the July snapshot possible! Here are some Preliminary Snapshot Data from 7/30/14. Additional nutrient data to come!

SITE System DATE Time of Sampling Weather pH  Sp Cond (us/cm) Turbidity (NTU)
ARD Androscoggin 7/30/2014 12:30 Cloudy, ~60, recent rain 6.99 31.29 1.25
ARU Androscoggin 7/30/2014 12:08 Cloudy, ~60, recent rain 6.81 29.93 1.22
BAT Borthwick Ave 7/30/2014 8:45 Clear, cool 8.16 1590 8.41
BBD Beaver Brook 7/30/2014 12:05 Clear, 70s 7.25 144.1 1.39
BBK Bogle Brook 7/30/2014   not sampled      
BBO Bear Brook 7/30/2014 7:40   5.78 76.65 0.729
BBU Beaver Brook 7/30/2014 11:15:00 Clear, 70s 6.75 69.15 0.988
BBW Beaver Brook 7/30/2014 10:00 Sunny, 70s 6.99 106.4 1.16
BDC Burley Demerrit 7/30/2014 7:00 60-70s, cloudy 8.09 271 1.55
BDD Blood Brook 7/30/2014   not sampled      
BDU Blood Brook 7/30/2014   not sampled      
BEC Beards Creek 7/30/2014 10:30 Cloudy, Mid-70s 8.09 381.2 6.06
BEF Albany Brook 7/30/2014 12:00   6.72 16.79 0.096
BLD Back Lake Brook 7/30/2014 7:40 Cool, no rain 7.43 67.75 1.58
BLU Back Lake Brook 7/30/2014 7:25 Cool, no rain 7.23 60.79 1.45
BRD Bellamy River 7/30/2014   not sampled      
BRU Bellamy River 7/30/2014   not sampled      
BSW Beaver Brook 7/30/2014 10:30 Sunny, 70s 7.24 1174 0.425
CBT Clay Brook 7/30/2014 10:51 Overcast, cool 6.57 39.27 2.33
CBU Clay Brook 7/30/2014 10:31 Overcast, cool 6.5 25.74 0.657
CCK Cart Creek 7/30/2014 10:15 Partly cloudy, 75 7.76 457.4 8.02
CHB Chesley Brook 7/30/2014 9:40 Cloudy, Mid 60s 7.88 251.9 2.02
COB College Brook 7/30/2014 9:55 Cloudy, Mid 60s 8.21 1338 2.62
CRD Creamery Brook 7/30/2014 12:00 Sunny 7.38 84.94 1.83
CRU Creamery Brook 7/30/2014 12:15 Sunny 6.97 86.46 0.655
CSP Cedar Swamp 7/30/2014 8:30 Partly cloudy, ~75 6.69 233.8 1.4
CTC Connecticut 7/30/2014 8:21 Foggy/ overcast, ~50 7.08 36.12 4.46
CTP Connecticut River 7/30/2014 6:45 Foggy, ~50 7.08 32.16 0.922
DBB Dube Brook 7/30/2014 9:05 Cloudy, Mid 60s 7.87 137.1 8.8
DCF Dowst-Cate 7/30/2014 9:45 Cloudy, Mid 60s 6.71 47.89 0.839
DGB Douglas Brook 7/30/2014 13:30 Partly cloudy, 60s, rain last 3 days 6.76 23.78 0.723
ELL Ellis River 7/30/2014 14:07 Partly cloudy, 60s 6.51 36.15 0.153
EMB Emerson Brook 7/30/2014     6.92 21.73 0.101
EXT Exeter River 7/30/2014 11:45 Partly cloudy 7.68 224.6 1.27
HBF Paradise Brook 7/30/2014 9:51 Cloudy 5.81 12.11 0.08
HCA Hosley Brook 7/30/2014 11:00 Cloudy, 70 6.43 17.57 1.25
HCB Hosley Brook 7/30/2014 11:50 Cloudy, 70 5.88 30.32 1.06
HCD Hosley Brook 7/30/2014 11:45 Cloudy, 70 6.82 32.75 1.01
HCE Hosley Brook 7/30/2014 11:20 Cloudy, 70 6.25 19.4 0.405
HCF Hosley Brook 7/30/2014 12:00 Cloudy, 70 6.78 31.05 0.892
HCG Hosley Brook 7/30/2014 1:00 Cloudy, 70 6.78 33.04 1.06
HCH Hosley Brook 7/30/2014 12:50 Cloudy, 70 6.71 33.7 1.28
HCI Hosley Brook 7/30/2014 12:30 Cloudy, 70 6 33.23 1.82
HCJ Hosley Brook 7/30/2014 1:15 Cloudy, 70 6.66 29.9 0.832
HOB Hodgson Brook 7/30/2014 9:30 Clear, cool 8.13 851.2 1.24
HYB Halfway Brook 7/30/2014 9:30 Mostly cloudy 7.24 81.57 0.874
IDM Ispwich Dam 7/30/2014 9:30 Partly cloudy, ~75 7.92 388.3 1.95
IRD Israel River 7/30/2014 9:05 to 9:07 Cloudy, 55-58 6.73 42.29 0.971
IRU Israel River 7/30/2014 10:46 to 10:51 Cloudy, 55-58 6.66 23.19 0.359
JOB Johnson Brook 7/30/2014     7.23 22.51 0.218
LND Pemigewasset River 7/30/2014 10:43 Cloudy 6.19 21.26 0.268
MCQ McQuesten Brook 7/30/2014 10:45 Cloudy, 60 to 70 7.87 694.5 1.6
MEB Middle Brook 7/30/2014 10:45 Cloudy 7.32 77.09 1.31
MMR Merrymeeting River 7/30/2014 9:05 to 9:17 Overcast, 68 7.16 75.29 1.21
MOD Moose River 7/30/2014 9:05 Cloudy 6.57 32.5 0.37
MOU Moose River 7/30/2014 8:40 Cloudy 6.85 51.29 0.455
MOX Merrimack River 7/30/2014     6.86 71.97 1.94
MRC Mad River 7/30/2014 9:20 Cloudy 6.48 32.41 0.379
MRL Mad River 7/30/2014          
MUC Merrimack River 7/30/2014 11:00   6.97 58.9 8.76
MUM Merrimack River 7/30/2014 7:25 Overcast, 63 7.02 77.29 6.49
MWW Merrimack River 7/30/2014     6.97 94.91 1.81
NED Contocook 7/30/2014     6.97 70.1 1.22
NEU Contocook 7/30/2014     6.98 66.88 1.23
NSB Salmon Brook 7/30/2014 9:30 Mostly cloudy 7.77 442.5 2.18
NWD Newfields Ditch 7/30/2014 9:04 Clear, cool 8.18 996.2 2.55
OBG Otter Brook 7/30/2014   not sampled      
OGS Oyster River at USGS 7/30/2014 9:25 Cloudy, Mid 60s 7.78 264.7 7.34
OMP Oyster River at Mill Pond Dam 7/30/2014 10:50 Cloudy, Mid 60s 7.82 285.2 5.85
OSS Ossipee River 7/30/2014 10:35 Mostly cloudy, ~71, 2.5" rain last 3 days 6.81 46.75 0.649
PBB Pine Bend Brook 7/30/2014 11:15 Partly cloudy, rain last 3 days, 60 6.72 16.85 0.146
PBD Piscataquog 7/30/2014 8:42 Cloudy 7.15 75.16 1.14
PBI Main Piscataquog 7/30/2014 8:00 Cloudy 6.96 87.67 5.26
PBU South Piscataquog 7/30/2014 7:51 Cloudy 7.06 71.17 1.39
PBI_Duplicate Main Piscataquog 7/30/2014     7.21 88.88 4.38
PBU_Duplicate South Piscataquog 7/30/2014     6.98 71.1 1.18
PDM Parker Dam 7/30/2014 10:40 Partly cloudy, ~75 7.94 377.1 4.24
PEB Pettee Brook 7/30/2014 10:10 Cloudy, mid 60s 8.18 1029 2.41
PGS Paugus Brook 7/30/2014 1:15 Sunny 6.51 19.21 0.134
PIN Pine River 7/30/2014 10:10 Mostly cloudy, ~71, 2.5" rain last 3 days 6.55 47.03 0.895
PRF Pemigewasset River 7/30/2014 8:15 Cloudy 6.47 39.99 9.81
PRG Piscataquog 7/30/2014 9:45 Partly cloudy 7.22 92.88 1.46
PRP Pemigewasset River 7/30/2014 11:09   6.69 39.64 3.29
PRW Pemigewasset River 7/30/2014 10:59 Cloudy 6.39 39.68 0.267
PWU North Piscataquog 7/30/2014 7:12 Cloudy 7.06 59.35 0.776
RBH Rand Brook 7/30/2014 10:48 Partly sunny, ~68 7.18 67.26 1.19
RHL Red Hill River 7/30/2014 10:00 Mostly cloudy 7.23 68.7 0.706
SBK Sawmill Brook 7/30/2014 7:40 Partly cloudy, ~ 75 7.15 1078 3.73
SBM Saddleback 7/30/2014 9:30 Cloudy, 60 to 70 5.1 29.91 0.909
SCD Dead Dimond River 7/30/2014 10:05 Mostly cloudy, ~50 6.73 25.71 1.53
SCS Swift Diamond River 7/30/2014 10:25 Mostly cloudy, ~50 6.89 24.31 2.06
SHB Schoolhouse Brook 7/30/2014 11:25 Partly Cloudy, ~68 7.05 32.95 0.276
SLB Slide Brook 7/30/2014     6.83 18.81 0.11
SNB Shannon Brook 7/30/2014 11:00 Cloudy 7.08 58.34 1.82
SQB Unnamed Belnap Woods 7/30/2014 9:50 Overcast, 70s, heavy rain last 2 days 7.28 97.9 0.95
SQM Mill Brook 7/30/2014 10:10 Overcast, 70s, heavy rain last 2 days 7.1 50.28 0.562
SQR Squamscott River 7/30/2014 12:04 to 12:10 Sunny/ overcast 7.85 5.5 8.54
SRM Swift River 7/30/2014 13:45 Partly cloudy, ~60, Rain last 3 days 6.2 21.89 0.312
SRU Swift Upper 7/30/2014 9:30 Partly cloudy, 60, last 3 days 6.04 33.88 0.276
SRN Sugar River North 7/30/2014 8:35 Cloudy, cool 7.18 76.59 3.32
SRS Sugar River South 7/30/2014 9:00 Cloudy, cool 7.08 83.98 2
SWP Storm Drain (Highland St) 7/30/2014 11:20 Cloudy 8.07 1884 0.395
TPB Trout Pond Brook 7/30/2014 8:30 Cloudy, 60 to 70 6.65 18.95 0.748
USW Pemigewasset River 7/30/2014 10:15   6.35 42.47 0.316
WAM Wild Ammonoosuc 7/30/2014 11:45 Sunny 6.68 30.85 0.332
WBG Whittle Brook 7/30/2014 9:31 Partly cloudy 7.34 109.4 0.311
WHB Wednesday Hill Brook 7/30/2014 7:30 Cloudy, 60 to 70 7.14 364 2.01
WIN Winnepesauke River 7/30/2014 7:43 Cloudy 7.1 100.5 9.81